

 Salesforce’s Educational Data Model (“EDA”) is an innovative and flexible architecture that gives educational institutions from K-12 to higher education a way to capture a 360–degree view of their students. With EDA, institutions can easily view the relationships that students have with faculty, staff, academic advisors, family members, and even memberships with academic departments and student organizations. It’s truly an innovative data architecture built on the Salesforce platform designed to facilitate a Connected Campus.
While EDA makes it easy to view details about the student lifecycle within Salesforce, it doesn’t always support the robust analytical needs that many institutions have come to expect. This is because the strength of the EDA architecture is designed to allow users to view and take action on student data within Salesforce – not to facilitate a multi-dimensional view for reporting and analytics.
So what’s a university to do when it needs to allow users to perform a complex analysis of retention and graduation rates? The answer lies in transforming the EDA data into an analytic database that supports multi-dimensional queries using Einstein Analytics.
Einstein Analytics for Educational Business Intelligence
Einstein Analytics is uniquely designed to generate insights from the EDA model. Not only can Einstein Analytics transform EDA data into datasets that are useful for answering questions about retention and institutional effectiveness; but because Einstein Analytics is closely integrated with Salesforce, users can take action directly on records from within Einstein Analytics itself.
For example, if an academic advisor discovers that a cohort of students is at-risk for withdrawing from the university, she can instantly take action – sending a customized mass email, auto-assigning tasks, or even engaging directly with students to resolve the issue. All of this happens with minimal clicks within a customized dashboard view.
Moving from EDA to an Analytical Architecture – Identifying the Key Questions
It’s clear that Einstein Analytics can take data from EDA and transform it into datasets that are suitable for conducting analytical investigations. But what should those datasets look like? What EDA objects and fields should be used, and how should the data be structured? Viewing the EDA Entity Relationship Diagram below, it’s clear that institutions can capture data related to their students on a variety of dimensions — academic enrollments, case management, relationships, and organizational memberships.
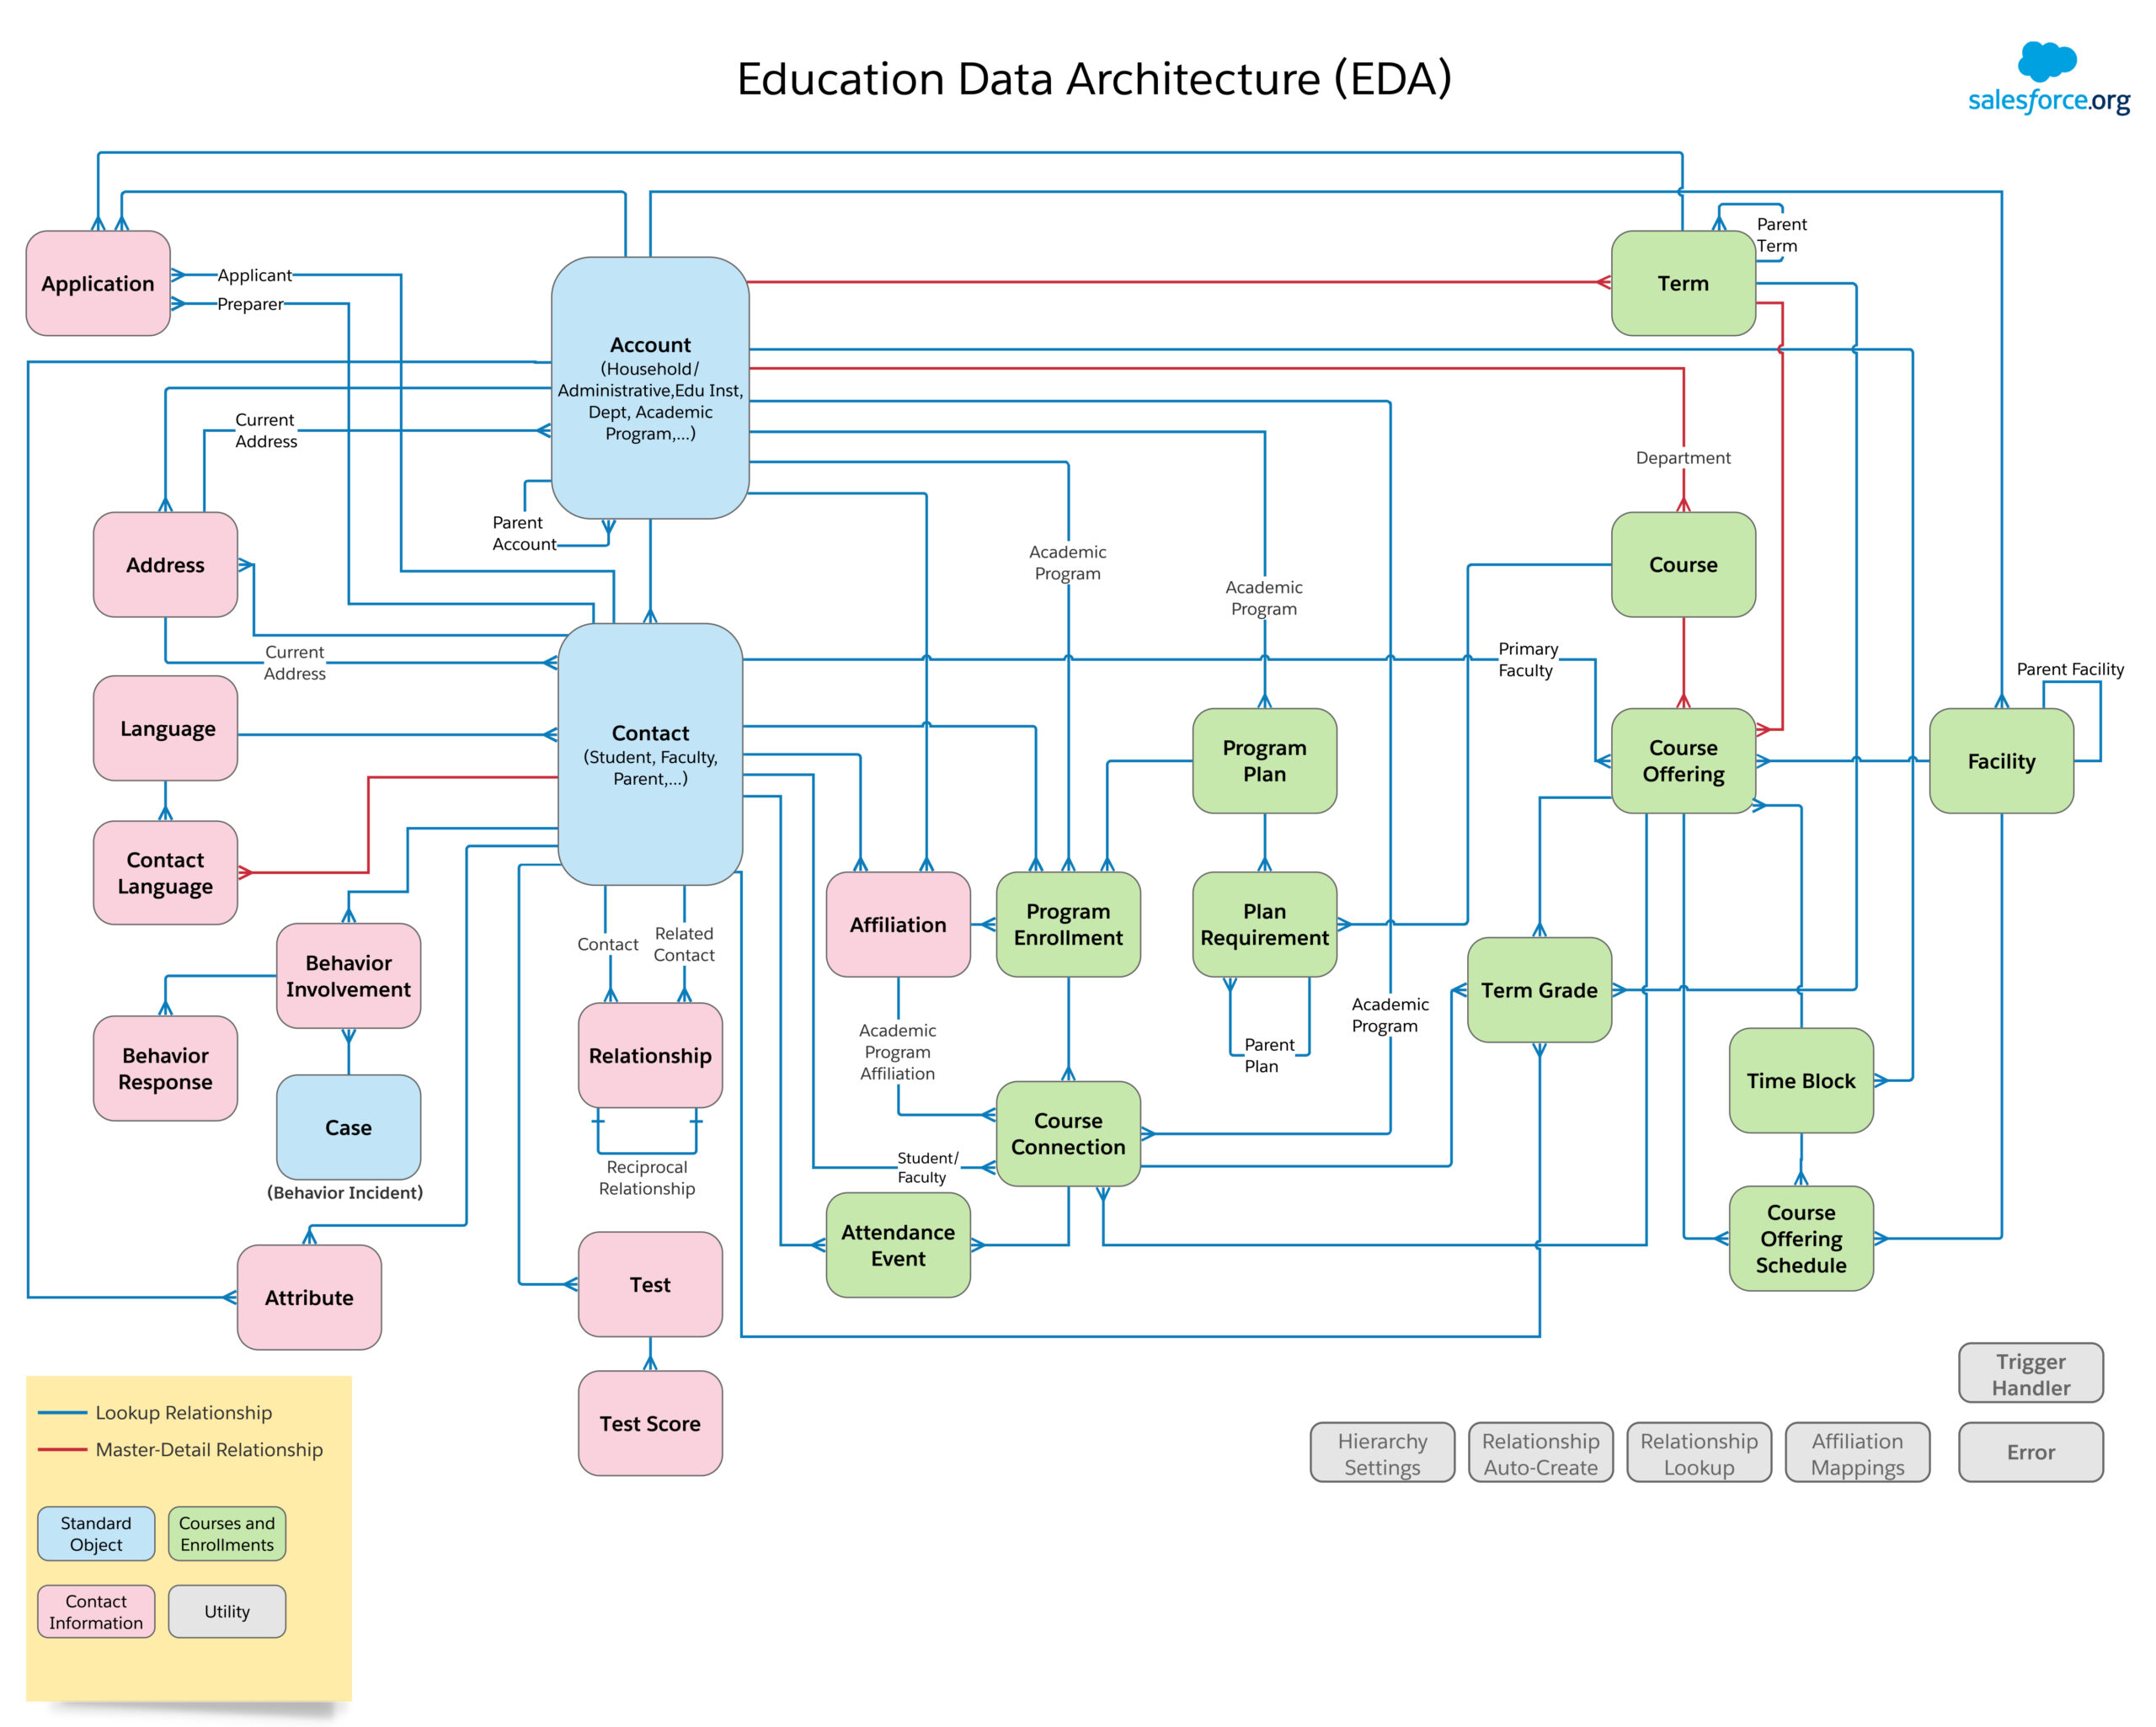
Source: https://s3-us-west-2.amazonaws.com/sfdo-docs/eda_entity_relationship_diagram.pdf
However, not all of the EDA data is useful to an institutions analytical inquiries. It’s not necessary to import the entire EDA model into Einstein Analytics. Rather, institutions should take a more strategic approach. The key is to decide what data is needed to provide answers to the questions each institution is asking. In making the leap to an analytics-focused solution, the important question to ask is “What problem is my institution trying to solve?” Answering this question allows institutions to design the appropriate data visualizations as well as identify the underlying data that will support the visualizations.
Below are just a few examples that institutions can use in beginning discussions of how Einstein Analytics can solve problems using the EDA model:
- What courses have the highest failure of withdrawal rates?
- What period of time before the semester begins is a student unlikely to enroll in classes?
- Is there an association between class registration date and success in that class?
- What factors contribute to a student receiving a D, F, or W grade in a class?
- What recruitment efforts will have the most impact in generating student applications?
- Which courses should be offered next year / semester and how many seats are required?
After an institution determines its list of questions, the next step is to identify what kind of data is needed to provide answers and where is that data stored? Additional discovery will be conducted to determine the quality of that data and if there are any data gaps that need to be addressed so that the institution can utilize the best data to answer its key questions.
Next Steps – Designing Visualizations and Dataset Creation
After data has been identified, the institution can get to the exciting task of designing data visualizations that will allow users to have a conversation with their data. (It’s important to note that this design phase may also elicit additional data discovery). In the next blog post of this series, we will walk through the process of drafting a key question related to student retention, how to identify the appropriate data in the EDA model, and discuss how to transform the data into datasets that provide a flexible multi-dimensional format for complex data analysis.